Source: Dr Shane Oliver, Chief Economist – AMP Capital
Snapshot
- Starting point valuations for shares matter a lot in terms of medium-term return potential and vulnerability to share market falls. Basically, the cheaper the better.
- Developed market shares are not dirt cheap (and haven’t been for several years) but on most measures they are not at overvalued extremes. US shares are most at risk, but other markets are reasonable.

Introduction
Some commentators claim shares are way overvalued and so a crash is inevitable. As always, it’s a lot more complicated, but given the current turbulence in share markets it’s worth having a look at whether share markets are expensive or not as a guide to how vulnerable we are to further falls. More broadly, valuation measures provide a guide to future return potential.
Why valuation matters – the cheaper the better
First a bit of background on valuation. A valuation measure for an asset is basically a guide to whether it’s expensive or cheap compared to the income it generates. Simple valuation measures are price to earnings ratios (PEs) for shares (the lower the better) and yields, ie the ratio of dividends, rents or interest payments to the value of the asset (the higher the better). An obvious example of where the starting point valuation matters critically is cash. For some years now, bank term deposit rates have been historically low meaning returns are low and value is poor.
For government bonds the yield is similarly a good guide to value. Over the medium term the main driver of the return a bond investor will get is what bond yields were when they invested. While the relationship is not perfect, it can be seen in the next chart – which shows a scatter plot of Australian 10-year bond yields (horizontal axis) against subsequent 10-year returns from Australian bonds based on the Composite All Maturities Bond index (vertical axis) – that the higher the bond yield, the higher the subsequent 10-year return from bonds.
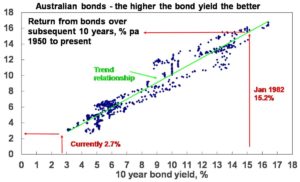
Again, despite rising a bit in the last two years, bond yields remain low so low returns should be expected from bonds.
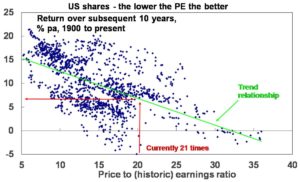
For shares a similar relationship holds. The following chart shows a scatter plot of the PE ratio for US shares since 1900 (horizontal axis) against subsequent 10-year total returns (ie dividends and capital growth) from shares. While it is not as smooth as with bonds as there is more involved in shares, it indicates a negative relationship, ie when share prices are relatively high compared to earnings subsequent returns tend to be relatively low.
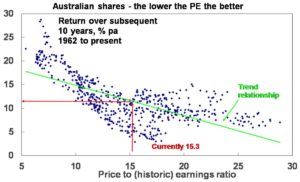
The next chart shows the same for Australian shares. Again, there is the expected negative relationship between the level of the PE and subsequent total returns (based on the All Ords Accumulation index).
The key is that the starting point valuation matters. The higher the yield (or the lower the PE) the better.
Complications to be aware of
Of course, there are several pitfalls with valuation measures that investors should be aware of:
- Sometimes assets are cheap for a reason (value traps). This is more often associated with individual shares, eg, a tobacco company subject to an impending law suit. These traps can really only be picked up by thorough research.
- Valuation measures are a poor guide to timing. Eg, if an investor sold shares short in 1996 when Fed Chair Greenspan warned of “irrational exuberance” they would have lost out as shares rose for another four years. Australian residential property has been overvalued for almost 15 years but that’s been no guide to timing a fall in home prices. The key is to have a thorough investment process that depends on more than just valuations.
- There is a huge range of share market valuation measures. For example, the “earnings” in the PE calculation can be earnings reported over the last 12 months, consensus earnings expectations for the year ahead or earnings that have been smoothed to remove cyclical distortions. All have their pros and cons. For example, the historic PE is based on actual data with no forecasting, but it can give the wrong signal during a recession as earnings may collapse more than share prices and so the PE may not give a buy signal.
- Finally, the appropriate level of valuation can vary depending on the environment. For example, in a period of low inflation and low interest rates it’s well-known that assets can trade on lower yields as the interest rate/yield structure in the economy falls. This in turn means higher PEs. So low inflation, say down to around 2%, can be good for shares via higher PEs. But if inflation goes from “low” to deflation it can be bad as it tends to be associated with poor growth and so shares trade on lower PEs.
The message from all this is that share market valuation is important, but you ideally need to assess it along with other indicators if you are trying to time market moves. The key is to acknowledge that when a range of valuations measures are at an extreme then they are probably providing a signal that should not be ignored.
So what are current share market valuations signalling?
Let’s start with price to earnings ratios using historic earnings, ie, earnings reported for the last 12 months. In the US, this PE is currently around 21 times which is consistent with subdued medium-term returns going by the second scatter plot on the previous page. But in Australia at around 15.3 times it’s consistent with reasonable medium term returns according to the third scatter plot on the previous page. Of course, current levels for historic PEs in the US and Australia have both been associated with a very wide range in terms of subsequent returns historically. Furthermore, PEs based on historic earnings are not totally reliable given the cyclical volatility in reported earnings.
Given this, calculating the price to earnings ratio using 12 month ahead projected earnings are arguably more useful. These are shown in the next chart for global shares, the US and Australia. None are way out of line with their averages since the early 1990s but in a relative sense US shares on a forward PE of 16.1 times remain a bit expensive albeit less so than earlier this year, and global shares are a bit cheap trading on a forward PE of 14.2 times thanks to cheap markets outside the US.
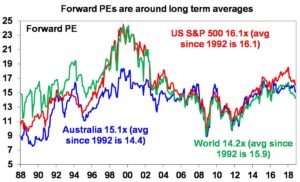
In emerging countries, the average forward PE is quite low at around 10 times.
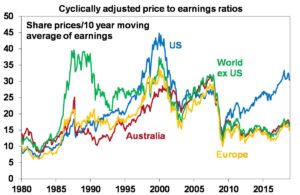
The next chart looks at price to earnings ratios calculated using a 10-year moving average of earnings, which is often referred to as the Shiller PE (after economist Robert Shiller) or the cyclically adjusted PE. On this measure US shares are clearly more expensive than since the tech boom. However, markets outside the US, including Europe and Australia, are not expensive at all. It should also be allowed that the 10-year moving average earnings calculation is distorted by the earnings slump a decade ago. As the 2008 and 2009 earnings slump starts to fall out of the calculation, the US Shiller PE will start to fall. But still there is better value elsewhere.
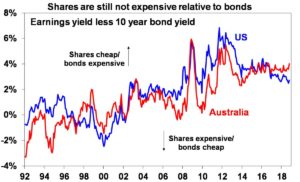
Finally, it’s worth looking at share market valuations that allow for the fact we are still in an environment of relatively low interest rates and bond yields. The next chart subtracts the 10-year bond yield for the US and Australia from their earnings yield (using forward earnings). This basically gives a sort of a proxy for the equity risk premium – the higher the better. While this gap is well down from its post GFC highs, it’s still reasonable, suggesting shares are still more attractive than bonds. Of course, this will change as bond yields drift higher, but as we have seen over the last two years since bond yields bottomed, this is likely to remain a relatively slow process.
The overall impression is that measured against their own history developed country share markets are not dirt cheap, but they haven’t been for several years now and they are not at overvalued extremes. The main risk relates to the US share market, but other markets’ valuations are reasonable. So while the pull back in shares we have seen over the last few weeks could go further yet – as worries around the US interest rates, US/China trade, rising oil prices, problems in the emerging world, President Trump and the US mid-term elections and the Italian budget remain – at least most share markets are not trading at overvalued extremes which would potentially accentuate downside risks.